


By THE ALASKA STORY
Jan. 30, 2026 – US fertility fell again in 2025, dropping to 1.58 births per woman, with approximately 3.60 million births nationwide. But the decline is not evenly distributed across the country.
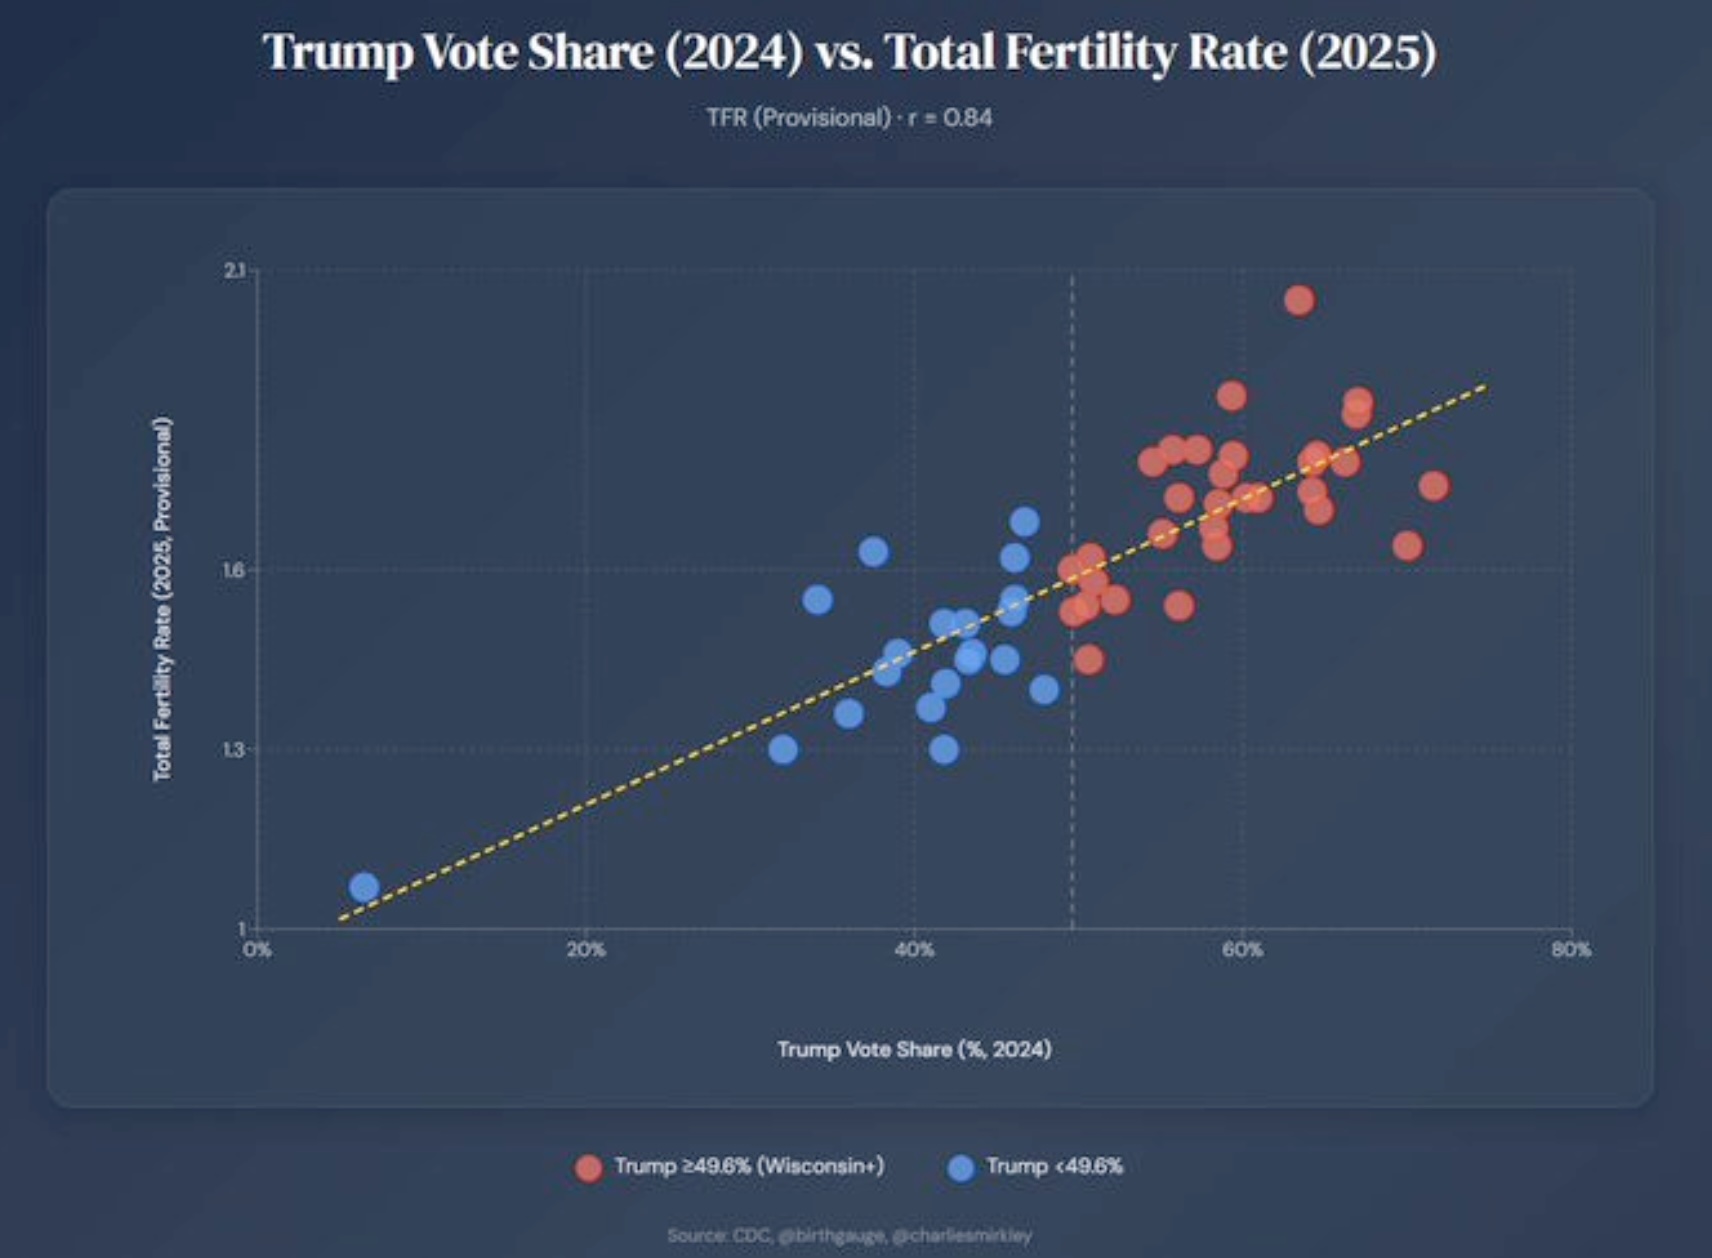
The above chart, which overlays 2024 Trump vote share by state with the CDC’s 2025 provisional total fertility rates, highlights a demographic and political divide that is increasingly difficult to ignore.
States with higher levels of support for Donald Trump in the 2024 election consistently show higher fertility rates, while states with lower Trump support cluster at the lowest fertility levels. The correlation coefficient is approximately 0.84, an unusually strong relationship for social data, indicating that the pattern is not random noise but a meaningful structural divide.
Geographically, fertility is holding up most clearly in the rural Midwest and Plains states, with South Dakota remaining near replacement-level fertility. By contrast, coastal and highly urbanized states dominate the bottom of the fertility scale, clustering well below the national average. These regional patterns persist even as the national birth rate continues to decline.
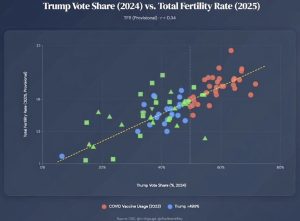
We overlaid Covid vaccine usage on this chart and came up with even more striking results: The greater the consumption of Covid vaccine by the state, the lower the fertility rate:
This divide reflects different life models: Higher-fertility states tend to be characterized by earlier marriage, higher religiosity, lower housing pressure, family-centered cultural norms, and less delayed childbearing. Lower-fertility states tend to show the opposite patterns: high urbanization, high housing and childcare costs, delayed family formation, dependence on dual high-income household models, later marriage, and later first births.
The chart is even more telling when we consider that the fertility rate among American Muslims, which are lumped into blue states at a higher rate, is higher than the US average, with women having an average of approximately 2.4 to 2.5 children. This means non-Muslim liberals are not having children and that the replacement of the population of some blue states is trending Muslim over time.
The highest percentages of Muslims are in states with strong Democratic political, including Illinois (3.7% of the population), New York (3.6%), New Jersey (3.5%), and Maryland (3.1%).
What emerges is a feedback loop: The groups that are having more children are also the groups that will shape future school systems, labor markets, cultural norms, and political coalitions. Over time, this creates a self-reinforcing system in which demographic change and political alignment increasingly track together.


6 thoughts on “Chart of the day: How Trump Country is outgrowing blue America”
If a married couple is able to ŌĆ£have as many children than you can affordŌĆØ said by Charlie Kirk, then have more kids because you know why he said that?
If you wait to get more money first before adding a child. Guess what!!! You will think youŌĆÖll never have enough money before adding one more child to your family. YouŌĆÖll never have more than two.
The willingness and ambition for most couples to increase their successes and income will come (because of more kids!) because of the love they feel for their spouse and children. You may not be able to live life taking 4000 dollar vacations as a childless couple and single could do but you and your spouse will always make just enough that yourselves and children even if you have five-12 children that you all are provided for.
Guess what! Parents leading by example of a responsible adult who pays their bills and correctly raised the children. Then in your twos old age you have Senior secuity by having five or 12 working adults and their spouses (so 24 adults all together) all looking after you and your spouse while you are in your 60s,70s,80,90s. What better life is that when in your old age you really need younger adults around you all because you didnt wait and worry about not having enough money. YouŌĆÖll never have just more kids than you could presently afford maybe first by birth before adding more children by adoption.
Birthrate correlates negatively with increasing educational attainment, and lower educational attainment correlates positively with Conservative political orientations. Combine the two, and you have the observed result. You seem to have forgotten this factor.
Ask any population statistician and they will tell you the same thing.
Hans, I assume you are talking about years of schooling and not education. Anyone with a positive rate of educational attainment would know that years of schooling and increasing educational attainment are not mutually exclusive. Sometimes the results in increasing educational attainment are negatively impacted by increasing amounts of schooling specificially when said instruction is gear towards what to think instead of how to think. Unfortunately nowadays too many think that being told what to think is the same as being instructed on how to think, hence the confusion by some regarding schooling and education by those who have been told what to think.
You are totally right Hans. In fact you and your ilk ought to continue to double down and reduce your birthrate further so y’all can have increasing educational attainment. Then unconnected, without family, miserable, you can die alone and pass on your legacy to no one. It fits your worldview that ultimately you are just meaningless worm food. So a thums up from me and my fellow stupids – and our large families.
Hans, like every other good conformist radical leftist extremist, you confuse years of Marxist and globalist indoctrination from the propaganda mills known as “universities” with “education”. The two could not in fact be further apart.
.
And before you make the baseless accusation that I just know that you otherwise would, please be aware that I know whereof I speak, having had a university education myself (but in the sciences, not in one of the squishy, feminine, emotion-based subjects).
So, cat ladies, AWFULs, the sexually confused and deranged, and the self-loathing do not tend to breed.
.
Who would have guessed it?